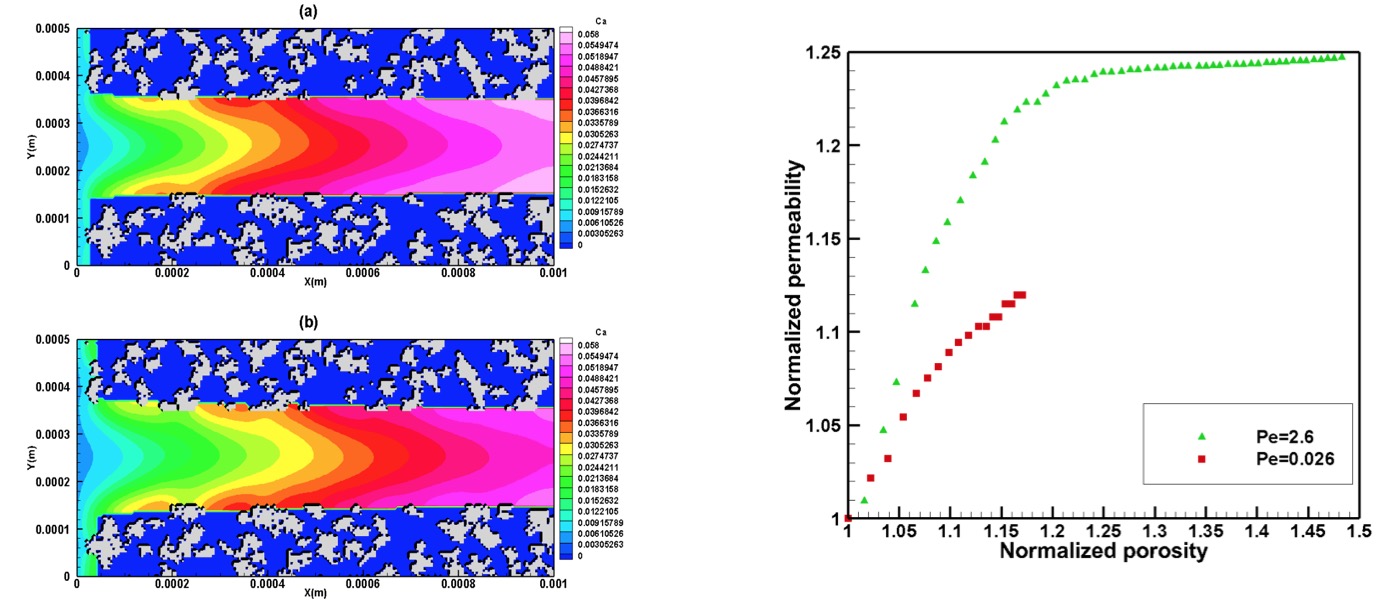
Fig 2.3. Ca concentrations(mol/L) at (a) t = 1.5 hr, (b) t = 4.9 hr. In all three cases Pe= 2.6. Kaolinite mineral is depicted in light gray and zero concentrations (blue) are showing the calcite. Right panel shows normalized permeability vs normalized porosity at two different Pe numbers for initially mixed mineral assemblage (Fazeli et al 2017).